© Edizioni Centro Studi Erickson, Trento, 2021 — Psicoterapia Cognitiva e Comportamentale
Vol. 27, n. 1, febbraio 2021
ONLINE
Improving Therapy Outcomes Using Neurofeedback and Biofeedback
Michael Thompson1 and Lynda Thompson2
Abstract
Neurofeedback and Biofeedback are effective and well-validated interventions that can enhance patient outcomes by improving self regulation. These learning techniques are within the practice parameters of Psychologists, as well as being utilized by other health professionals. Despite their efficacy, they are not yet widely utilized, perhaps because too few university training programs in Psychology offer courses in psychophysiology. To introduce the benefits of adding these interventions to a psychologist’s practice, this paper begins by noting how even one or two biofeedback sensors can greatly enhance a psychotherapy session. The authors then outline assessment procedures, which may include EEG measurements and a stress assessment. Data from these assessments are used to plan individualized interventions. The neurofeedback training procedures recruit neuroplasticity to improve functioning. Additionally, this paper briefly describes what can be expected with respect to patient outcomes when you change neural networks. Finally, there is a brief review of research findings regarding efficacy of neurofeedback and biofeedback. The authors hope that this introductory paper facilitates the addition of neurofeedback and biofeedback to clinical practice in order to achieve better outcomes.
Keywords
Neurofeedback, Biofeedback, Attention deficit, Hyperactivity disorder, Psychophysiology.
online
Migliorare gli outcome della terapia con l’adozione di Neurofeedback e Biofeedback
Michael Thompson3 e Lynda Thompson4
Sommario
Neurofeedback e biofeedback sono interventi efficaci e ben validati che possono migliorare gli outcome dei pazienti migliorando l’autoregolazione. Queste tecniche di apprendimento rientrano fra i parametri di pratica degli psicologi, ma sono usate anche da altri professionisti della salute. Nonostante la loro efficacia, il loro utilizzo non è diffuso, forse perché sono pochissime le facoltà di Psicologia che propongono corsi di psicofisiologia. Per presentare i vantaggi di usare questi interventi nel lavoro dello psicologo, questo articolo evidenzia in primo luogo come anche uno o due sensori di biofeedback possano potenziare notevolmente una seduta di psicoterapia. Gli autori descrivono quindi le procedure di valutazione, che possono comprendere l’EEG e la misurazione dello stress. I dati così ottenuti vengono usati per programmare interventi individualizzati. Le procedure di training con il neurofeedback coinvolgono la neuroplasticità per migliorare il funzionamento. L’articolo descrive inoltre brevemente che cosa ci si può aspettare, in termini di outcome del paziente, quando si modificano le reti neurali. Infine, vengono esaminati sinteticamente i risultati di ricerca sull’efficacia del neurofeedback e del biofeedback. Gli autori si augurano che questo articolo introduttivo favorisca l’adozione del neurofeedback e del biofeedback nella pratica clinica per ottenere outcome migliori.
Parole chiave
Neurofeedback, Biofeedback, Deficit dell’attenzione, Disturbo da iperattivi.
Introduction
Anyone can benefit from improving self-regulation of emotions and attention. Even Olympic athletes benefit from training that combines neurofeedback (NFB) and biofeedback (BFB). Alexandre Bilodeau, Gold medal winner in freestyle skiing at the 2010 Olympic games in Vancouver, said this about his training, «It reduced my tension and increased my focus».
He did 40 sessions of single channel neurofeedback and biofeedback training as part of his preparation for the Olympic games and became the first Canadian to win a Gold medal on Canadian soil.
At the 2008 Olympics, in Beijing, Abhinav Bindra became the first athlete from India to earn an individual Gold medal, beating the Russian and Chinese air rifle shooters who were expected to win.
He had done about 150 hours of neurofeedback plus biofeedback training with Tim Harkness, a psychologist from South Africa who later worked with the Chelsea football club.
The same kind of training is done every day to ameliorate symptoms in patients, both children and adults, by hundreds of clinicians, including at the authors’ ADD Centre in Toronto, Canada. (See www.bcia.org for a list of people certified in bio- and neurofeedback, including three in Italy, and listings of training programmes.) Whether the client is an athlete, an executive, a child with Attention-Deficit/Hyperactivity Disorder or an adult suffering from anxiety and depression, the basic approach is the same.
To measure brain waves before starting neurofeedback, an active electrode is placed at the top of the person’s head (the central position at the vertex, called Cz, with a reference electrode on one ear-lobe and a ground on the other ear-lobe. This allows the measurement of electrical activity from the brain, called the electroencephalogram, or EEG. The EEG pattern is monitored and the client receives feedback about their brainwave patterns. Healthy patterns are rewarded with visual and auditory feedback, so the learning is based on operant conditioning principles.
Among the most commonly used biofeedback modalities is heart rate variability (HRV) training.
A sensor is placed on a finger or thumb to detect pulse and an elasticized belt around the waist measures respiration. With those two sensors in place, HRV training is done by monitoring heart rate and respiration rate and achieving synchrony between them.
Figure 1.
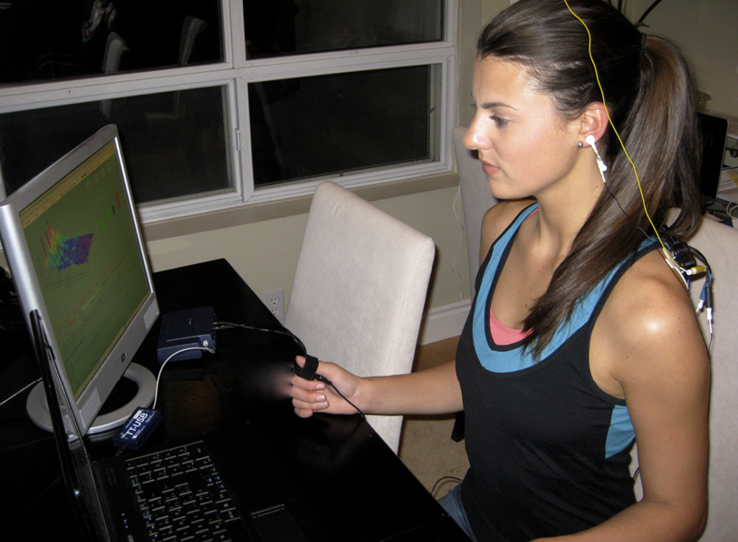
From The Neurofeedback Book (2015) Athlete (competitive swimmer) doing NFB + HRV training to improve her performance. The illustration shows an active EEG electrode at Cz and a reference electrode on her left ear lobe. She has a pulse sensor for HR on her right thumb and a respiration belt around her waist.
Psychologists can make a start in this field by adding a small amount of biofeedback to their psychotherapy practice. Even simpler than heart rate variability training is adding a skin conductance measure (also called electrodermal response or EDR, previously called galvanic skin response or GSR). Small sensors placed on two fingertips monitor arousal. Higher skin conductance, mediated by the sweat response, indicates higher arousal; thus, you can tell when your client is becoming anxious or upset about something. Another simple biofeedback measure is skin temperature: the practitioner can attach a temperature sensor to one finger to provide information concerning anxiety: warmer hands mean relaxation and cold hands suggest anxiety because there is reduced blood flow to the peripheral nervous system. These psychophysiological measures make it easier to monitor emotions that might otherwise be hard to detect. Figure 2 shows the changes in finger temperature and skin conductance/electrodermal response over a 45 minute session. This 16-year-old boy had a diagnosis of Asperger’s syndrome and suffered from severe social anxiety. Like most patients with Asperger’s, he did not show his emotions by facial expression and he spoke only in a low monotone voice without intonation. The graph illustrates a large drop in peripheral finger temperature (red) and rise in skin conductance (EDR in green) when his mother entered the room about 6 minutes after the interview had started. She left and then the therapist left to briefly speak with her and there is a rise in skin temperature and fall in the EDR as he relaxed while alone about 13 minutes into the recording. The doctor re-entered the room and there was then a rise in EDR and a drop in skin temperature. The doctor and patient were discussing difficulties at school with his peers, which produced a sharp fall in skin temperature and rise in EDR. The practitioner could tell the severity of the reaction only by the physiological changes that were measured. In order to end the session with the patient in a more positive mental state, he changed the subject to allow the patient to discuss his favourite topic and immediately saw the skin temperature rise and the EDR fall as the patient relaxed.
Figure 2
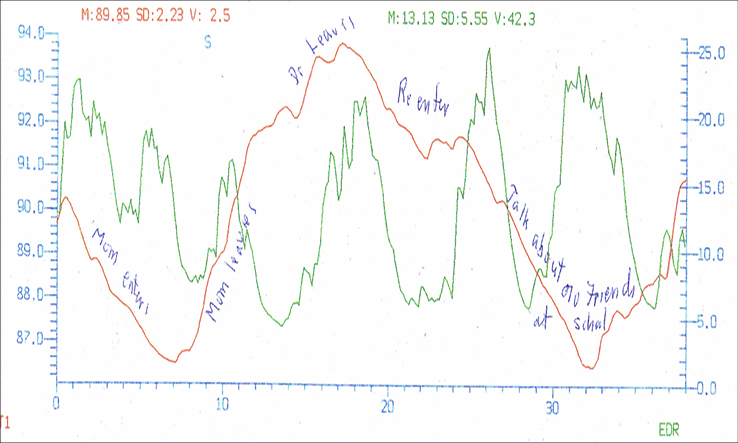
Finger temperature and arousal (EDR) changes during a therapy session.
Think about how valuable these sensors might be during couples therapy: the therapist and the clients can immediately see the physiological responses to what is being said. What otherwise might have seemed an unimportant remark by one person can be seen to evoke a very strong response in the spouse. Some practitioners may be content with adding some physiological measures during their therapy sessions. Others may wish to study further about how training to improve self-regulation of responses can be done and then they can add neurofeedback and/or biofeedback training to their practice. There is simple equipment available that monitors and gives feedback about temperature, pulse and skin conductance/electrodermal response with a single sensor on one finger (Thought Technology, TPS sensor). The information can then be displayed on the therapist’s computer or, for home practice, on a client’s cellular phone. If the patient places that finger and TPS sensor on their abdomen, then respiration (diaphragmatic breathing) is also recorded and heart rate variability can be trained.
Neurofeedback and biofeedback practitioners are health-care professionals. They are always, first and foremost, clinicians, so psychotherapy and counselling remain a cornerstone of their practice. These practitioners have added to their therapeutic repertoire a detailed knowledge of the physiology of the brain and of the autonomic nervous system (ANS), functional neuroanatomy, electrophysiology, EEG instrumentation, understanding of EEG patterns and their relation to mental states, and how to use training programs that incorporate EEG, heart-rate, breathing, peripheral skin temperature, electrodermal changes, and electromyogram (EMG) feedback to help each patient optimize their performance.
The highest levels of efficacy for neurofeedback training (also called EEG biofeedback or brain computer interface/BCI training) are for the treatment of Attention-Deficit/Hyperactivity Disorder (ADHD) and for reducing frequency and intensity of seizures in Epilepsy. Biofeedback receives the highest efficacy level for the treatment of anxiety and related disorders. This is important for clinicians because attention span and anxiety are core difficulties in many disorders that are characterized by anxiety and/or depression and also are fundamental problems in developmental disorders such as learning disabilities, Asperger’s syndrome, Autism Spectrum Disorders and ADHD. With many of these serious disorders, improving ability to sustain attention and decreasing anxiety should be dealt with first to enable the patient to then deal with their other symptoms. The ability to self-regulate is a better predictor of success in adult life than intelligence, as explained by Daniel Goleman in his book Emotional Intelligence in 1995 and validated by numerous researchers since then. For this reason, improving attention and reducing anxiety is a goal for nearly all clients at the ADD Centre and Biofeedback Institute of Toronto.
The beginning point is a comprehensive assessment, whether training is done for athletic, executive, or academic reasons or to decrease symptoms in a patient with a disorder. The first interview will define the patient’s goals, take a history and assess their strengths and their perceived weaknesses. The psychologist will review available information concerning the patient’s past performance, ask about medications and other interventions they have tried or are presently using. After the interview, EEG data are recorded (single channel at Cz) and a brief neurofeedback session is done. At our centre, questionnaires and self-report measures are done as well as objective measures: continuous performance tests (IVA-2, T.O.V.A.), and a computerized neurocognitive test battery (CNS Vital Signs). Other testing, such as a 19-channel EEG with evoked potentials, heart rate variability, and other biofeedback measures, can be added based on the results of this initial test battery and client goals.
Improving Attention Span
Attention Deficit Hyperactivity Disorder (ADHD) is a significant problem for many patients. About 1 in 7 boys in the United States is diagnosed with ADHD and Americans spend 13 billion dollars annually on drugs for ADHD (The Economist, Feb.2018). But medications only work with about 75% of children and less than 60% of adolescents and adults. James Swanson in a 15 year follow-up of the multimillion dollar, multimodal treatment for ADHD (MTA) study, found no significant difference in symptoms at age 25 for those patients treated with medications compared to the group who had no medications. However, there was a significant difference in height: the medicated group averaged one inch shorter (Swanson et al., 2017). Side effects of medications may not be innocuous. In a recent retrospective study, ADHD patients had more than twice the risk of developing Parkinson’s and Parkinson’s-like diseases. The risk for early onset — ages 21 to 66 — was 8.6 times higher in patients with ADHD who had taken prescribed stimulant medications, including methylphenidate (Ritalin), mixed amphetamine salts (Adderall) and dexmethylphenidate (Focalin). This large epidemiological study (n = 4,960 for ADHD patients prescribed stimulants, and n = 158,790 for the non-ADHD comparison group) is one of the first to report long term effects (Curtin, 2018). These studies indicate clearly that other treatments that can achieve long term positive results without side effects should be sought. Neurofeedback meets these criteria (Gani et al., 2008).
What changes in the brain with decreased ability to sustain attention, whether in someone with a disorder or in executives and athletes? When you lose your attention, you move from the brain’s Attention Network and activate the Default Network instead. For example, just prior to a lapse in attention, activity decreases in areas that control attention, including the dorsal anterior cingulate cortex (ACC), and the prefrontal cortex (Figure 3). During a lapse in attention, activity is in a portion of the default network: posterior cingulate cortex (PCC: Brodmann areas (BA) 23, 31) and the retrosplenial cortex (Rsp: BA 29, 30).
The Rsp is a brain area thought to encode information critical for spatial navigation through the surrounding world and it has connections to the hippocampal region and the temporal lobe. It is, therefore, involved in memory functions. This corresponds to a shift of attention from the externally oriented Attention network to the interior orientation of the Default network (Weissman, 2006). If you were given a list of words to remember when this shift occurs, the preceding words would be forgotten once activity shifted to the Default network (Li et al., 2007) In go-nogo tasks, just before errors, activity is in the default network. At these times this network includes the medial prefrontal cortex (MPFC) BAs 9, 10, 12, 25, insula (BA 13), the posterior cingulate cortex (PCC: BA 23, 31), retrosplenial (BA 29 & 30) cortex, and inferior parietal lobule (BA 39, containing the angular gyrus, and BA 40 containing the supramarginal gyrus) (Otten & Rugg, 2001). Thus activity, when this shift occurs, is not in the attention network. However, outward attention with broadly tuned, low-level watchfulness does also involve Default activity monitoring of the external environment (Buckner et al., 2008).
The shift between the Attention Network and the Default Mode Network occurs very rapidly and shifts can alternate, going quickly back and forth. There is also shifting between different attention networks; for example, from the ventral attention network (involved in selecting what to pay attention to) to the dorsal attention network (involved in sustaining attention) as diagramed in Figure 4.
Figure 3
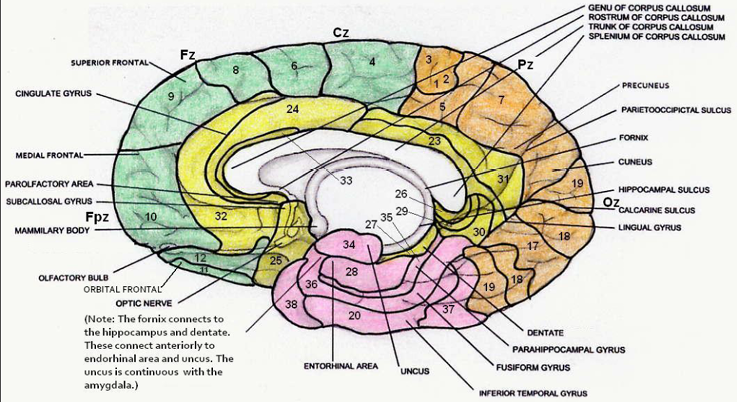
Mid-sagittal section showing Brodmann areas. From The Neurofeedback Book, 2015.
Brodmann area numbers go from 1 to 52. However, BA 14, 15, and 16 are not found in humans but are cell types found in the insular cortex of non-human primates. BA 13 is in the insula, which is an infolding of cortex and is not visible in the mid-sagittal view shown in this diagram.
Figure 4
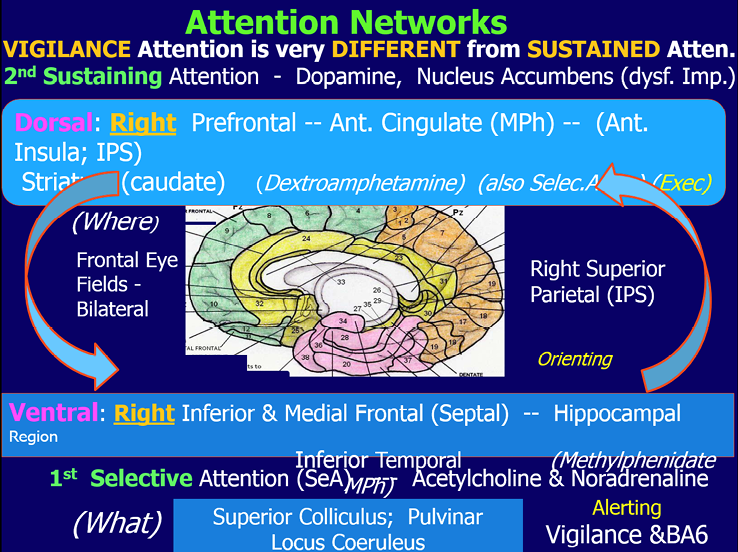
By Michael Thompson,from The Neurofeedback Book, 2015. This figure shows some of the components of the ventral and dorsal attention networks.
The most widely used method for improving attention is decreasing theta (usually 4-8 Hz) when it is very high amplitude and increasing beta (13-15 and/or 15-18 Hz) in the frontal (Fz) or central (Cz) sensori-motor strip areas of the brain. Frontal theta reduction can be very successful but not posterior theta reduction. In the posterior, occipital and parietal regions, inattention can be associated with high amplitude alpha activity.
Ogrim and Kropotov 2019 note that the prefrontal cortex (PFC) regulates attention based on relevance/meaning, screening distractions, sustaining, shifting, and dividing attention. They confirm that the PFC is sensitive to changes in dopamine and norepinephrine, requiring optimal levels of these neuromodulators. Thus, ADHD patients with deficits related to the anterior attention system are good candidates for stimulant medication and for NFB that decreases theta and increases beta. However, they also emphasize that posterior attention deficits may require different treatments. Neurofeedback can effectively treat the three patterns found in those with ADHD; the excess theta (approximately 85% of cases), the excess alpha («daydreamers») and the excess beta (busy brain) (Thompson & Thompson, 2015).
Assessment
After a comprehensive history is taken in the first interview, the patient is given a test battery as mentioned above. Subjective measures include parent behavioural rating scales (Conners’ rating scale, SNAP DSM–IV, and the ADD-Q from The A.D.D. Book (Sears & Thompson, 1998) or, for adults, self-rating scales. All patients are asked to do a draw-a-person and this simple technique has consistently demonstrated marked positive changes that are posited to reflect self-image. Objective measures include two computerized continuous performance tests, (Test of Variables of Attention/T.O.V.A. and the Integrated Visual and Auditory continuous performance test (IVA+).
The task is to respond to targets and inhibit responding to non-targets. The reaction time variance is one of the scores calculated for these tests and it is highly variable in patients diagnosed with ADHD; indeed, variability of response time is a more sensitive measure than the number of omission and commission errors.
An EEG biomarker for ADHD is high amplitude frontal or central theta and/or high amplitudes of high frequency beta. A 3-minute, single channel eyes open EEG with the active electrode placed at Cz, the reference on the left ear lobe, and the ground on the right ear lobe, is the initial EEG measurement. The results are graphed on an excel spread sheet and then discussed with the patient or the parent.
For attention problems, the Monastra-Lubar published theta / beta power ratios (4-8Hz)2 / (13-21Hz)2 are used to help the patient and/or parents understand when the ratio is outside the expected range, for age, found in the normal control group (Monastra et al., 1999, 2005).
A small number of patients may tune out with high amplitude alpha or high amplitude high frequency beta as mentioned previously. Examples of theta and alpha brain waves are shown in Figure 5 and spindling beta in Figures 11 & 14. The patient also does computerized neurocognitive testing.
There are versions for both children and adults and the Central Nervous System (CNS) Vital Signs computerized tests (available in many languages) are well normed and they take only about 45 minutes to complete.
These tests can be repeated for progress testing after 20 and 40 sessions of neurofeedback training.
If a 19 channel EEG is done, we can look for another biomarker for ADHD in the evoked potential results: there is a long latency and reduced amplitude of the P300b response measured at Pz.
Figure 5
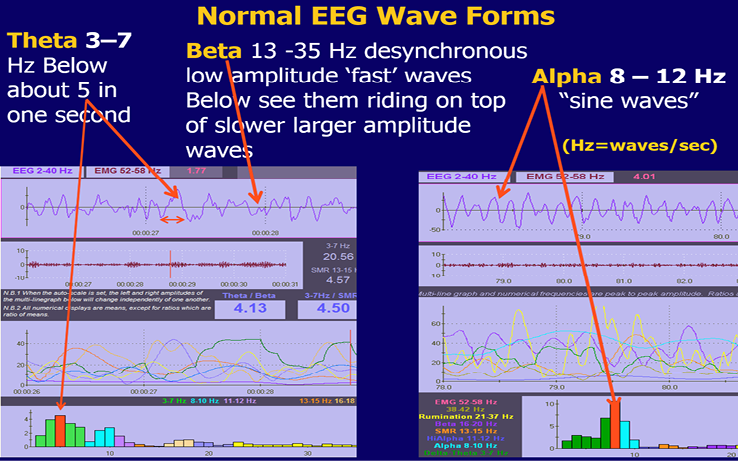
Screens to illustrate theta and alpha waves.
Stress Assessment
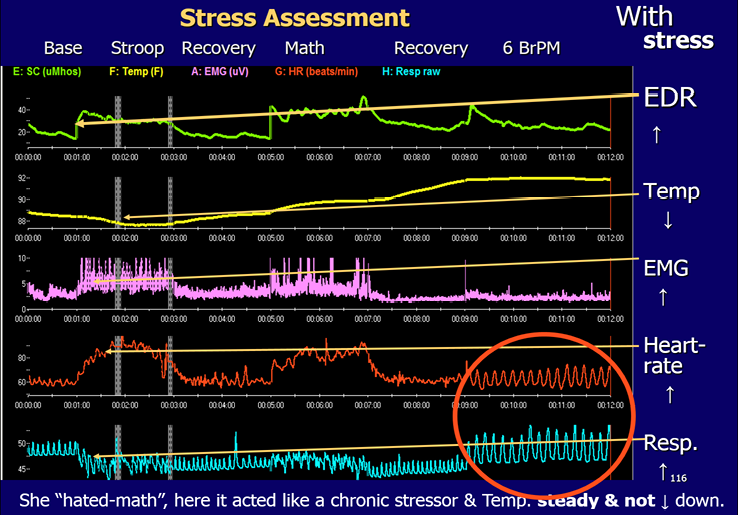
When anxiety is a major problem, adult patients may also be given a stress assessment. This usually takes about half an hour. At our Centre we use sensors on the index and ring fingers (or across the palm) to measure electro-dermal response (EDR) for skin conduction. Sensors, usually on the trapezius muscle area or the forehead, are used to measure muscle tension. This is called electromyography (EMG). A sensor on the little finger is used to measure skin temperature. These biofeedback statistics are all tonic measures related to «sympathetic» tone. We also place a blood volume-pulse (BVP) sensor on the thumb for Heart Rate (HR), and an elastic belt around the abdomen for Respiration Rate (BrR). HR and respiration measurements allow the calculation of heart-rate variability statistics (HRV). Like the EEG, heart-rate variability is an oscillating system and HR is controlled by parasympathetic vagal input to the heart. Oscillating systems can make permanent changes with training whereas tonic measurements are not permanent changes. The stress test is available on-line in the Thompson Clinical Success Suite from the Biofeedback Federation of Europe, for use with Thought Technology Biograph Infiniti equipment. To do the stress assessment the adolescent or adult is asked to sit in front of the computer monitor for a one minute baseline, followed by 2 minutes stress (Stroop colour test), 2 minutes recovery, 2 minutes math stress (such as serial sevens), 2 minutes recovery, 3 minutes diaphragmatic breathing at approximately 6 breaths per minute while relaxing (Figure 6). The patient will rapidly be able to see, first, that their physiology will change rapidly with stress: finger temperature drops, EDR will rise as will muscle tension and heart rate, while breathing may become shallow, rapid, and irregular. The opposite will usually occur on one or more of these measurements when they relax in the last segment of the test as their breathing becomes synchronous with heart rate. The latter is circled and can be seen in Figure 6. This summary screen is calculated and shown to the patient immediately following the test (Thompson and Thompson, 2015a, 2020). Most people show physiological changes with stress. However, the most important factor, and the one that the therapist is watching for, is a change back to base-line levels for each of the variables during the 2-minute recovery periods. The patient in the illustration had an EDR that remained fairly high, though her EMG, heart rate, and respiration all returned close to base-line during the recovery periods. Physiological changes with stress that steadily build up through the day at work, for example, can be detrimental to one’s health and can interfere with social and marital functioning.
Figure 6
Stress Assessment of Physiological Variables; The Neurofeedback Book, 2015.
These changes in the biofeedback measures do correspond to stress (and to tension, anxiety, negative thinking). With even minimal stress one may observe: i. an increase in EDR (skin conduction), ii. a decrease in peripheral skin temperature, iii. an increase in muscle tension, iv. an increase in heart rate, v. rapid, irregular, shallow breathing. In the final segment with diaphragmatic breathing (circled) synchrony between heart rate and breathing can be observed. This patient demonstrates the expected decrease in skin temperature with the first stress, the Stroop. However, she shows an unusual increase in skin temperature with the math stressor. She panics with math and now shows the opposite change – an increase in temperature – to that which is usually observed. She did relax in the final segment and her heart rate is in complete synchrony with her respiration.
Biofeedback Training
Heart Rate Variability (HRV) training uses the screen in Figure 7. Other BFB measures may be used to decrease sympathetic drive and help some patients relax. Most patients can consciously relax their shoulder (trapezius) and neck muscles and do diaphragmatic (abdominal) breathing (BrR) at about 6 breaths per minute for adults. Effortless breathing is often slower in tall, large men and a little faster in small women and children because the individual’s resonant frequency is related to blood volume (Lehrer 2007, 2020). They are told to just make 3 small blue mountains on the 30 second screen shown in Figure 7, with a longer exhalation than inhalation. We have confirmed Sterman’s findings in animals, cited in The Neuroeedback Book, that EEG Sensorimotor rhythm (SMR) is produced on the exhale. Theoretically, increasing SMR (13-15 Hz) amplitudes would also decrease anxiety and we do find that combining SMR neurofeedback with HRV training is extremely effective for inducing a calm yet focused state of mind. Most of our patients find that they can achieve synchrony between the red (HR) and the blue breathing rate (BrR) on this feedback screen. This synchrony can also be seen at the base of the sail-boat race NFB training screen (Figure 8). Training at our Centre combines NFB and HRV training.
Figure 7
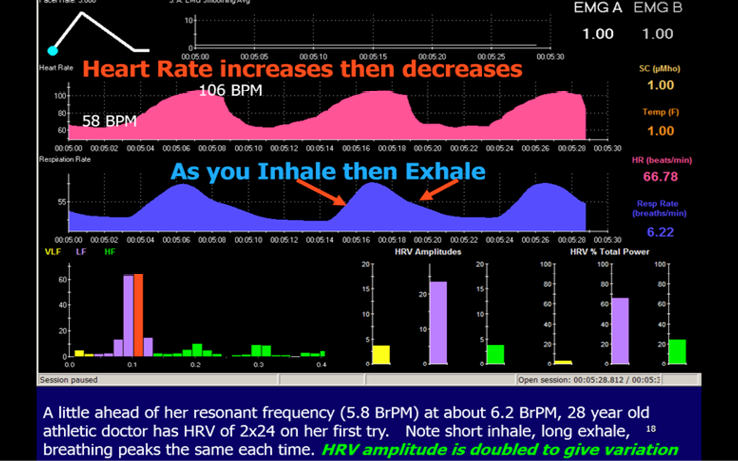
Training screen with computer smoothing of the Heart Rate showing an excellent result by a young athelete. Illustration from The Neurofeedback Book, with permission.
Figure 8
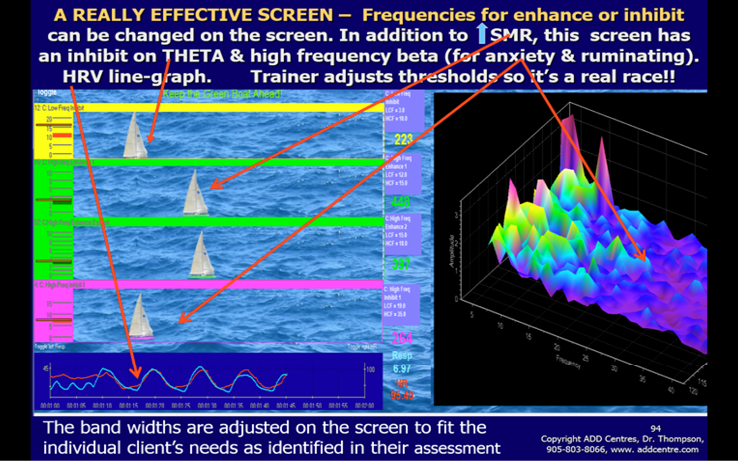
Patient’s training screen on the left with EEG feedback illustrated by the sailboat race and the HRV variables of breathing and heart rate changes, which becomes synchronous after a short time, at the bottom of the screen. The trainer’s monitor on the right shows a frequency (x-axis) by magnitude (y-axis) by time (z-axis) graph that illustrates how the client is doing over time.
For Heart Rate Variability training, we use the internationally accepted statistics, SDNN and power, that can be calculated using a program called Cardiopro, from Thought Technology. SDNN is the standard deviation of the beat-to-beat (R-R) interval in the electrocardiogram after is has been ‘corrected’ to remove the influence of artefacts, resulting in normalized (N-N) intervals. SDNN below 50 ms can indicate poor cardiac variability. This is often found, for example, following a concussion. There is a neuroanatomical and psychophysiological rationale for everything we do in neurofeedback and biofeedback. For HRV training, the rationale lies in the oscillating loop between the heart and the brainstem, specifically the nucleus tractus solitarius in the medulla. HRV is an oscillating system that involves alternating increases (when you breathe in) and decreases (when you exhale) in heart rate dependent on signals travelling between the heart and the solitary nucleus in the medulla of the brain stem. The basic dynamics of this are illustrated in Figure 9. When heart rate increases the blood pressure rises stretching the baroreceptor mechanoreceptors on the carotid and the aorta. When these receptors stretch signals are sent down the glossopharyngeal and vagal afferents to the solitary nucleus in the medulla of the brain stem. The result is that signals from the nucleus ambiguous in the brain stem go to the heart via the vagal parasympathetic efferents to the sinoatrial node. Vagal input will decrease heart rate and therefore the blood pressure. This causes the baroreceptors to decrease their afferent signals to the brain stem and the vagus input to the heart will decrease so the heart rate will increase and the cycle begins again.
Over time, increased heart rate variability – more rhythmic and higher amplitude changes in heart rate from one beat to the next – is achieved and is long-lasting. The EEG and HRV training both achieve long-term effects, whereas training other biofeedback modalities, like blood pressure or finger temperature, requires on-going practice.
Figure 9
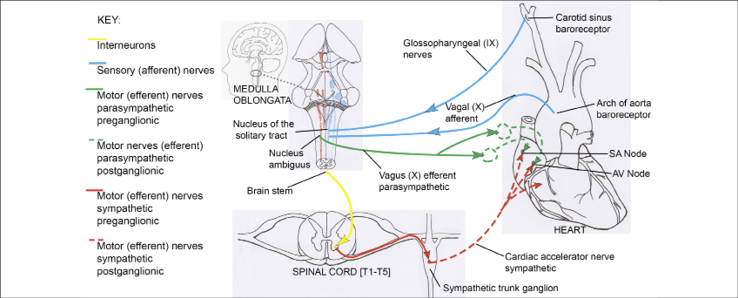
Schematic diagram of afferent and efferent ANS connections between the brain stem and the cardiovascular system. Drawing by Maya Berenkey, Section XVIII, The Neurofeedback Book 2015.
Neurofeedback Training
When patients are deemed appropriate for NFB plus BFB training, a 50-minute training program is typically done twice a week over a 20 week period for a total of 40 sessions. Neurofeedback sessions are conducted at a time based on patient’s preference (typically after school or work or during the weekend). For most patients, the single channel NFB training electrode is placed at Cz (adults at FCz). For some patients, the electrode was placed at C3 instead of Cz when there was a need to strengthen the functions related to left hemisphere, such as language, or at C4 to reduce hyperactivity. But there are other placements that are done for specific clinical reasons. For example, a child with dyslexia may have the active electrode placed over Wernicke`s area at the left temporal-parietal junction with the reference electrode placed on the right ear. Reference on the contralateral side will minimize common mode rejection by the amplifier. Activation of Wernicke’s area by increasing 14-18 Hz beta and decreasing 3-8 Hz theta has been very successful in improving reading and comprehension (Thompson and Thompson 2015a). Low impedances between each of the electrode sites are extremely important. Impedance is the resistance to flow of an alternating current and modern equipment will have a way of measuring it. Impedances between the electrodes are always checked before starting either an assessment or a training session. To meet research criteria, impedances between electrode sites should be less than 5 Kohms and within 1 Kohm of each other. Being close to each other is the most important criterion in order to avoid just training electrical noise or artifact instead of the patient’s EEG.
Each training session starts with a 30-second assessment screen to assess the baseline brainwave activity of the patient that day and make sure it is a good EEG without major artifact such as muscle tension. That screen shows both the raw EEG, graphed amplitude vs time and a spectrum, graphed magnitude vs frequency that is recalculated each second and shown at the bottom of the display (Figure 5). Then the patient works on neurofeedback screens, with a 2 or 3 minute training period for most screens. These screens usually have visual displays, including bargraphs showing EEG amplitudes, combined with auditory feedback that is the reward for meeting an adjustable threshold level. The bargraphs show magnitude of frequency ranges that are important for that patient (Figure 8). In Figure 8 the trainer can adjust the thresholds of the bargraphs on the left- hand side in order to make the sailboat race easier or harder (for example, reduce the SMR threshold to make it easier for that green sailboat to win the race). The criteria consist of training parameters that are based on assessment findings. Thus each training protocol is individualized. The protocol for the training screen for attention span improvement depends on the assessment findings. It may often include, for example, decreasing slow waves (theta waves: 4-8 Hz or 3-7 Hz), and increasing fast waves (beta wave: 15-18 Hz to target cognitive task -oriented activity or sensorimotor rhythm: 13-15 Hz to target hyperactivity and impulsivity symptoms). In order to discourage muscle tension, the effect of EMG on the EEG is discouraged by putting an inhibit on 52-58 Hz. This is done in order to ensure a good quality EEG signal. Basing training parameters on assessment is essential or major errors can result. For example, we assessed a child who was diagnosed as severe ADHD and who had high amplitude spindling beta at 14 Hz. When he had been placed on a standard protocol to increase SMR 12-15 Hz he became irritable, hyperactive and uncooperative almost immediately. When the feedback parameter was changed to increase 15-18 Hz, he became calm and soon was paying good attention and actively learning cognitive strategies that helped him at school and with his homework.
Average amplitude data (magnitude, measured in microvolts for each frequency range used in the feedback) is graphed for each segment of the training and the statistics are graphed at the end of the session. The trainer is responsible for setting thresholds and adjusting them during the session to assure learning is taking place. The trainer will gradually make it more difficult for the patient to receive rewards. To begin, the trainer will often place the theta threshold 1 microvolt below the assessment average and the SMR or beta threshold about ½ microvolt above the assessment average. The trainer encourages and coaches the patient by giving positive verbal feedback (i.e. «good job» or «stay focused») and giving children tokens. The treatment is always one to one with an enthusiastic trainer/therapist.
Metacognitive strategies related to academic tasks are taught and then practiced for 5-10 minutes during a longer segment of each session while the patient receives auditory feedback. Strategies taught during the session may include one or more of: organizational skills, memory strategies, active reading skills and active listening skills, essay writing strategies, and methods for doing times tables and solving math word problems etc. The students are taught how to employ mnemonic strategies to improve memory and how to make useful study notes. An entire chapter of The Neurofeedback Book is devoted to describing metacognitive strategies. ( Thompson & Thompson, 2003, 2015a). This on-task learning of strategies helps the patient to generalize the learning from the office setting to home and school. Our students really enjoy learning these strategies. Academic improvements and increases in IQ result and have been reported after neurofeedback treatment (Thompson & Thompson, 1998).
Throughout the session, children and adolescents earn tokens based on their performance. This can greatly enhance motivation. They are allowed to save the points in their bank account which is kept in their chart. The points can be exchanged for rewards from the «toy store» in the clinic or for gift certificates. At the end of each session the trainer reviews with the patient the strategy they practiced that day and the statistics showing their performance. If the patient is a child, then the child and the trainer meet briefly with the parent and discuss the results of that session using the statistics that are graphed and the child has the opportunity to explain the strategy that was practiced that session. We do always measure theta / beta ratios because these are well studied and in the literature. However, often the literature’s focus on «controlled» studies misses the real purpose of EEG training. Perhaps the most important outcome of training is the patient’s ability to «self-regulate» and not necessarily have any change in baseline resting state theta/beta ratios, though these do typically decline in those with ADHD. This point is illustrated in Figure 10 where post-training measurement of the theta/beta ratio does not change in the resting state but changes a great deal when the same person is involved in a cognitive task. Published studies do not appear to be measuring this important result of successful training with NFB. It is the improved ability to self-regulate at school, in work, and in all aspects of life that should be our goal. This ability can be a better predictor of how the child will succeed in life than even IQ.
Figure 10
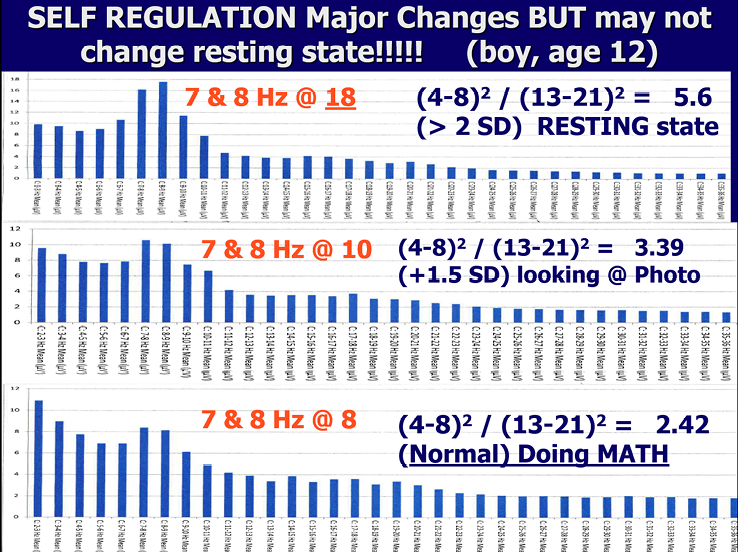
3 recordings show changes in mental state under different conditions.
Figure 10 illustrates how this child has learned to self-regulate in his NFB training. During eyes open, resting state the EEG shows his attention is drifting (high theta/beta ratio). However, he shows improved attention while looking at a picture and good attention with a normal ratio of theta/beta when doing math. He has a `hunter mind`and his resting state involves a wandering mind. BUT, when he needs to focus and do mathematics, he can control his attention. The Hunter Mind has many positives, including creativity, high energy and the ability to hyperfocus, which they do not lose during training. What they gain is the ability to self-regulate their attention and behaviour even for boring, academic tasks.
Patients and Caregivers are given suggestions for tasks/activities that they can do at home between sessions. The suggestions are given in a detailed booklet format and they include instructions for: Breathing, On-line cognitive exercises, Diet, Exercise, and Sleep. In English we use an acronym and say: What BODES well for Success?
Neurofeedback can be combined with medications but they need to be monitored. Usually it is possible to reduce the dose of stimulant medication in those with ADHD or of antidepressants in those with depression as self regulation of attention and emotions improve with neurofeedback training. Unfortunately, patients treated only with medications may have another complication. Medications, such as stimulations and anti-depressants, can cause down regulation of synaptic receptivity. Thus, when medications such as stimulants and antidepressants are discontinued, symptoms return. Vles et al., 2003; Yanofski, 2010, 2011).
Now it perhaps occurs to the reader that this down-regulation is exactly the opposite effect to that which occurs with learning. With repeated stimulation, as occurs during neurofeedback, the receptor sites at the synaptic junctions between neurons change and become more sensitive due to a process called long term potentiation (LTP). More receptor sites, including the NMDA sites on the receptor surface of the dendrite that were blocked by magnesium, are opened and, in addition, new receptor sites are formed. This has two completely different results as compared to use of medications. First, changes are only made by receptors that are involved in the learning of a new skill or state; thus, changes target specific brain networks. Second, these changes have the potential to be long-term if the pathways continue to be exercised. This process of LTP is postulated as being one of the factors involved in obtaining lasting effects after neurofeedback training.
Practical Considerations
At the ADD Centres in Toronto and Mississauga the authors developed a careful, combined approach using NFB plus biofeedback BFB plus very thoughtful counseling and coaching in metacognitive strategies. The relative importance of each of these components will differ from one patient to the next, and we cannot always predict what will be the most important component for a particular patient. It is helpful to have one instrument that combines all the modalities and allows the patient to see both the NFB & the BFB variables simultaneously. We designed screens that will do that using Thought Technology equipment and these are available on-line at www.BFE.org and are called «setting-up-for-clinical-success».
We expect our new staff to do more than 20 hours of self- training and this is a good idea for anyone entering the field. They additionally have a logbook to check off their required readings and learning progress. We encourage staff to complete all the requirements for certification that is available through the Biofeedback Certification International Alliance (BCIA).
Experience suggests that it is essential for NFB & BFB training be done 1:1 with a well-trained trainer and that that trainer be very good at adding metacognitive strategies for the on-task segments of neurofeedback. It is possible, for example, to do the correct NFB, according to a QEEG, in a dyslexic patient but not improve their reading. This can occur if one incorrectly «pairs» the attempt to read with a brain that is, at that moment, inactive over the dominant (usually left) temporal-parietal region. Our trainers are taught to only «allow» the patient to try and read when the EEG shows that they are focusing. If they lose their focus their eyes will glaze over and the EEG will show their characteristic brain wave pattern for tuning out: an excess of theta, alpha or high frequency beta. The instant that tuning-out occurs, the trainer will immediately cover the page being read with paper until the patient is focused. Then NFB resumes and the patient is rewarded for being focused while reading. When you pair the focused mental state with reading often enough, the two become linked and opening a book is a cue to go into a mental state of calm, focused attention.
We learned to avoid misunderstandings in training parameters by always stating exact frequency bands in Hz, such as 3-7 Hz or 9-10 Hz or 13-15 Hz, and not just using names such as theta and alpha and absolutely never referring to «beta1» or «beta2» without defining the band-width being referred to when setting training parameters.
We work a great deal with children, and so our equipment suffers a lot of wear and tear. A small internal break in a wire (even though externally it looks fine) will give uneven results. This is one reason to choose neurofeedback equipment that checks impedance (and offset when possible) quickly and easily. You want to have consistency in your EEG recordings from one day to the next. Even with 19 channel assessments, we usually do the assessment on two different pieces of equipment as a validity check.
We do not advocate stand-alone neurofeedback. An emphasis on proper diet, sleep, and exercise will allow a patient to get the most from their investment in the use of combined NFB and BFB to influence the appropriate neural networks. Sometimes counselling or psychotherapy is needed as well. Training at a single location can often affect many symptoms due to the influence the training has, not only on the structure beneath the site (such as the anterior cingulate when you train at FZ or Cz), but on the entire network(s) of which, for example, the anterior cingulate is a part. The cingulum is a white-matter fasciculus that runs through the centre of the cingulate gyrus and connects with frontal, central, parietal, and temporal lobes. We postulate that this may be one reason why training over the central midline structures (Northoff et al., 2006) at Cz and FCz may influence many different networks in the brain.
Training at one site may produce adjustments in brain activity in many areas that are functionally related in a network. Training over FCz, for example, may have effects on the affect, executive, attention, salience, and default networks. By focusing initially on training at one site and influencing appropriate networks, you will not run the risk of incorrectly changing positive, compensatory differences in the EEG that you could not predict, or of training down activity at sites that relate to specific high functioning that might show up as being outside a specific database’s average, («normal») z-score range. When you move to sites that are not over the central midline structures, be sure you understand the functional neuroanatomy related to that site (such as Wernicke’s area relating to aspects of language functioning and dyslexia) and can correlate that knowledge with your patient’s presenting symptoms.
19-channel Training
When patients present with very complicated symptom pictures, we will do a 19 channel quantitative EEG (QEEG) assessment with LORETA analysis for specific neuroanatomical localizations of the deviations. Then we base our interventions on these findings. We may still do single channel neurofeedback training or alternate single channel with 19-channel z-score training or do only 19-channel training, depending on findings. There are many companies that provide useful software and for our 19 channel assessments we have used Dr. Barry Sterman’s SKIL program, Dr. Juri Kropotov’s WINEEG, and Dr. Robert Thatcher’s Neuroguide. In the near future we will try the new Korean database that has separate norms for males and females. LORETA (low resolution electromagnetic tomography) applies mathematics developed by Roberto Pasqual-Marqui at the KEY Institute in Zurich and it gives a picture, rather like an MRI, that shows the source deeper in the cortex of EEG findings from the surface EEG. Programs like Neuroguide combine LORETA with a normative database to say how large a deviation is from the mean and to do source localization (within the cortex, not sub-cortical) of the activity being measured; for example, Figure 11 shows higher than expected amplitudes of 28 Hz beta measured at Fz were 2.1 standard deviations higher than the mean for women age 40 years and the source was anterior cingulate gyrus, Brodmann area 24 (Figure 11), lower right corner, shows a picture of the source (the red dot) using LORETA images that have been validated against MRI findings. Note that the beta spindling can be observed in both single channel (seen in the upper left hand portion of Figure 11) and 19 channel assessment data as well seeing it in the raw EEG.
Before beginning 19 channel LORETA z-score training, the reader can consult the Neurofeedback Book and Thatcher, Robert & Lubar, Joel (2014) Z-Score Neurofeedback and, for more detail, Robert Thatcher`s book Handbook of quantitative electroencephalography and EEG biofeedback: Scientific Foundations and Practical Applications, 2nd edition is also recommended. It is available through the Neuroguide/Applied Neuroscience Inc. website.
If differences from a normal database are found in many different locations, and if the deviations involve many different parameters (amplitude, coherence, phase) then it may be more efficient to use 19 channel Loreta z-score neurofeedback, even though the set-up necessitates using a 19-channel EEG cap, which takes much longer than single channel training.
Figure 11
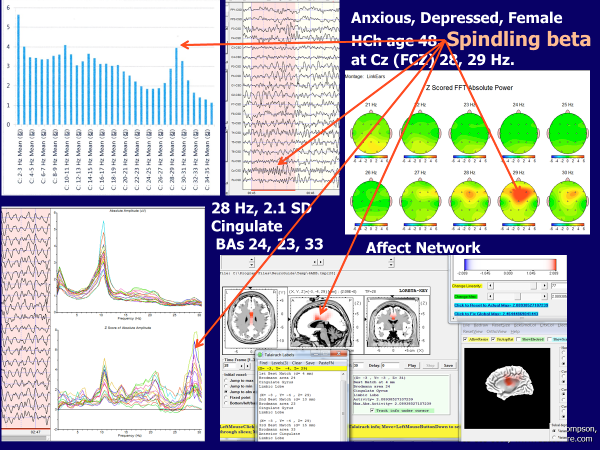
This figure, which is a composite picture that shows many different ways of viewing EEG data, illustrates how spindling beta at Cz can be seen in a brain-map (top right), an Excel graph of magnitude (y-axis) versus frequency 3-34 Hz (x-axis) based on single channel recording (top left), z-score (y axis) vs frequency 3-30 Hz (x-axis) lower left, and a LORETA image of horizontal, sagittal, and coronal sections of the brain with red dot indicting the source of excessively high amplitude of 28 Hz activity that is >2sd from the norm is in BA 24, anterior cingulate cortex.
Networks
The brain operates by activating networks that are relevant to a task. There is a massive literature on networks and there is now an atlas of white matter connections within the brain (Catani & de Schotten, 2012).
For our purposes, it is only important to note that, when doing NFB to treat symptoms related to attention and anxiety, that we are interested in affecting networks for Salience, Attention span, and Affect. In addition, we have already noted that, when one loses one’s focus and attention to a task, one moves instantly into a more internally oriented Default mode network. There are different networks for Vigilance, Salience, and Attention. The Vigilance network comprises the reticular activating system (RAS) for arousal, the locus coeruleus which produces noradrenaline (also for arousal), the right posterior parietal cortex (RPP) and the right prefrontal cortex (RPFC) for sustaining attention. But the brain can only consciously focus on one item at one time, therefore, the brain must choose what is the most important or salient item at any given moment in time. As the brain decides on what is the most important matter for its focus, it activates the Salience network.
The hub of shifts for Salience networking is the Anterior Insula. Salience network functioning allows for shifts between internal versus external focus and the choice of what is most important. To focus on anything, it must be salient and the most important item. To sustain that attention, it must remain the most salient item. The main components of the Salience Neural Network in the cortex and in the basal ganglia are: Dorsal and anterior cingulate gyrus (BAs 24 and 25), insula (BA 13), middle (BA 9, 10, 46) superior frontal area, para-central area (BAs 4, 5, 6), subcallosal gyrus, entorhinal area (BA 28) and uncus (BA 34), parahippocampal gyrus (BA 27), hippocampus (BA 35) and fusiform gyrus (BA 36) (Seeley et al., 2007).
Now the Attention networks come into play. This involves areas for alerting, orienting, and executive functions (Posner, et al., 2006). Rather than list the BAs, we refer the reader to a diagram from Posner and his colleagues, Figure 12. However, perhaps more important is understanding that there are ventral and dorsal networks for attention, as mentioned previously and shown in Figure 4. Corbetta and Shulman’s 2002 review article introduced the concept of two anatomically and functionally distinct attention systems in the human brain. Broadly speaking, a dorsal frontoparietal system was proposed to mediate the top-down guided voluntary allocation of attention to locations or features, whereas a ventral frontoparietal system was assumed to be involved in detecting unattended or unexpected stimuli and triggering shifts of attention. The Dorsal and Ventral Attention Systems are distinct neural circuits that have collaborative roles (Vossel et al., 2014). The Dorsal attention network is mainly in the right hemisphere and comprises BAs 8, 9, 7 and 40. The BA 40 for attention is centered on the intraparietal sulcus supporting task-related attention, for example increasing short term memory (STM) load.
The Ventral attention network comprises BAs 10, 11, 47, 39, 37 and the posterior portion is centered on the temporoparietal junction supporting stimulus-related attention; for example, task irrelevant stimuli that are novel, salient, and unexpected. One example of the importance of this network in cognitive functions is short term memory. With increasing short-term memory (STM) load, the dorsal attention network is activated while the ventral attention network is deactivated (Majerus et al., 2012).
By demonstrating a trade-off between task-related and stimulus-related attention networks during verbal STM, this study highlights the dynamics of attentional processes involved in verbal STM. The reader should just take away from this description the general sense that the brain makes a decision based perhaps on past memories plus affect and present situation – the ventral network – and then it turns on the dorsal network in the right hemisphere to sustain attention on that which it decides is the most salient subject matter (di Michele et al., 2005).
Figure 12
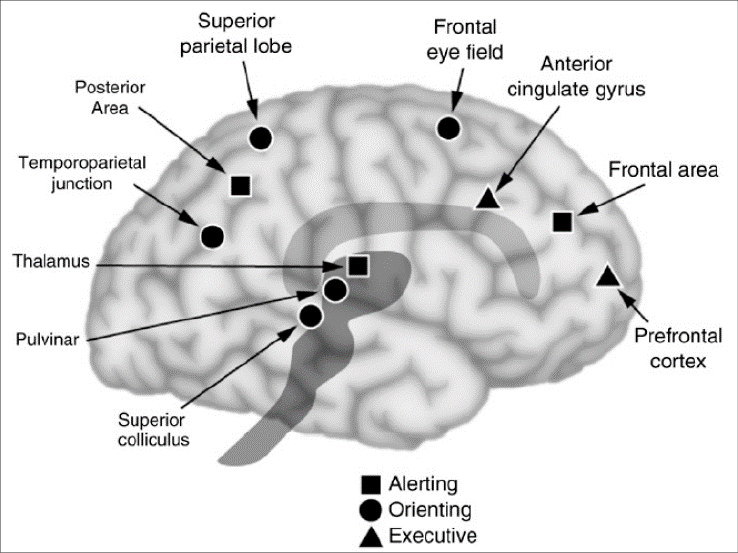
This figure is a simplified way of understanding three network components of attention (from Posner et al., 2006).
The key to successful and effective NFB is remembering that what you are affecting are networks. Networks link the Brodmann areas. The primary white-matter axon linkages are not new, they were described in Gray’s anatomy (1919) and are the white matter axon connections within each hemisphere, called fasciculi, and between the hemispheres, called commissures (Gray’s Anatomy figure 13 a & b). More recently, much more detail can be found concerning networks using new terms like Modules and Nodes (Hagmann et al., 2008; Bullmore & Sporns, 2012. This newer thinking identifies six regions in the brain each with its own central hub and connections. These are the basis of neural networks but are far too complex for this paper and are not necessary for a basic understanding of Networks affected by neurofeedback.
Figure 13a
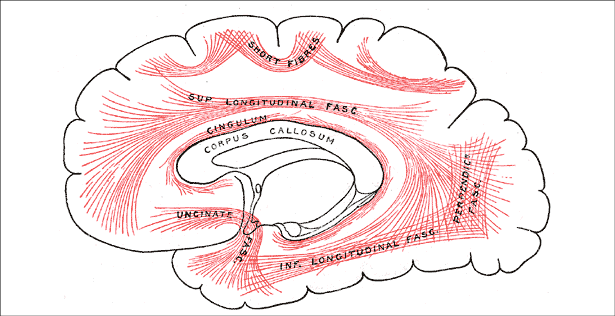
The major fasciculi and the largest commissure, the corpus callosum (from Gray’s Anatomy, 1919).
Figure 13b.
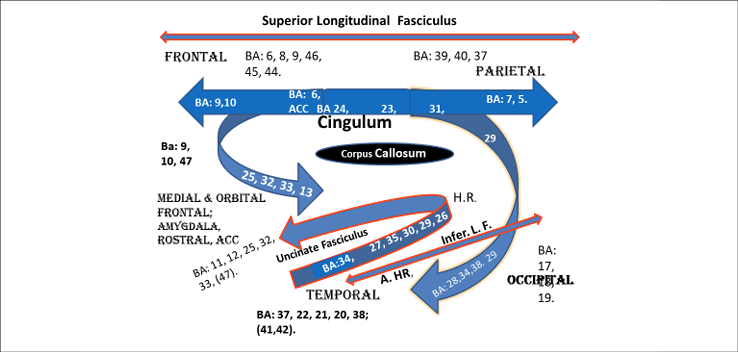
Some of the BAs connected by Fasciculi in each hemisphere. (From The Neurofeedback Book, 2015).
We are also targeting networks for anxiety and post-traumatic stress syndrome. For NFB in patients who are anxious, we target areas in anxiety networks including: the middle frontal gyrus/frontal polar cortex (BA10), lateral frontal cortex (BA 46), rostral anterior cingulate cortex (BA 32, 25), inferior frontal cortex (BA 11,) and the superior temporal cortex (BA 38), the culmen (cerebellum), and the amygdala (Blair et al., 2008, Curtin, 2018). We also look at and target other major areas such as the medial frontal cortex (Thayer et al., 2009) and the anterior ventral cingulate BA 25 (Mayberg et al., 2005). The biofeedback methods for decreasing anxiety combined with alpha training are well published (Rice et al., 1993; Sarkar et al., 1999). But more recent work has focused on heart rate variability training (Gevirtz, 2013, 2020 in press). Thayer published on the tonic inhibition by the medial frontal cortex of the central nucleus of the amygdala, which connects directly with the locus coeruleus and can therefore influence noradrenalin output and the sympathetic nervous system (Thayer et al., 2009, 2012). Mayberg has published considerable research on surgically implanted devices to allow stimulation of BA 25 and how this can positively affect symptoms of depression with anxiety that have not responded to medications and psychotherapy. However, Vincent Paquette from the University of Montreal has obtained similar results to Mayberg`s surgical implantation research in people with intractable depression by decreasing spindling beta (source from BA25) using surface neurofeedback combined with psychotherapy (Paquette et al., 2009).
For treatment of attention and anxiety we have choices. We can hit every synapse that responds to neuromodulators throughout the entire brain using medications and risk side effects or we can use NFB to influence one or more neural networks by normalizing the EEG over one key site. Single channel NFB may influence multiple networks through connection of the cingulum and uncinate fasciculi while doing related tasks to influence entire network(s). Or we can target multiple BAs and connections between BAs using 19 channel of EEG and LORETA z-score NFB. LORETA 19 channel z-score NFB can inhibit bursts of activity that are above data base norms and enhance dips in the amplitude of waves that are below data base norms while also normalizing phase and coherence (connectivity) between BAs.
Case Example
An example of single channel NFB, with placement of the electrode at FCz is a 40 year old woman who had earned 2 doctoral degrees but who was unable to pass her practical exams in Chiropractic college. She met the DSM-IV criteria for: ADHD, Asperger’s, Panic and Anxiety Disorders and, in addition, she demonstrated visual-spatial deficits. Her single channel EEG at Cz demonstrated low amplitude sensory-motor rhythm (13-15 Hz) and very high amplitude spindling beta at three different frequencies: 20, 23, and 32 Hz. Three characteristics distinguish normal beta EEG waves from Spindling Beta – very high amplitude, a narrow frequency range and waves that are synchronous. They have the shape of alpha waves but are much faster frequencies than alpha. Figure 5 shows theta and alpha waves and Figure 14 shows beta spindling. When a 19 channel EEG was done near the end of her training, LORETA demonstrated that the source of the beta spindling for her was BA 24 in the anterior cingulate gyrus. Her treatment was single channel NFB at FCz to increase SMR and decrease her spindling beta while at the same time increasing her HRV. Her panic attacks stopped, anxiety and attention span were no longer problems for her and she passed all her exams.
Figure 14
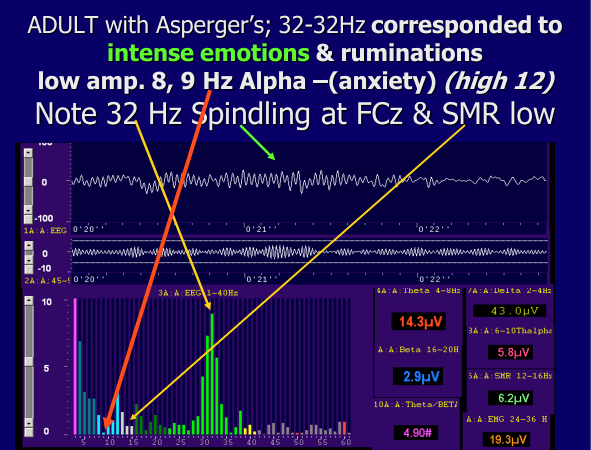
Example of spindling beta (The Neurofeedback Book 2015) When 32 Hz amplitude rises 12-16 Hz SMR decreases. She could consciously self regulate and concentrate after training and then she could lower the amplitude of the spindling beta and raise the amplitude of SMR. Note also the low amplitude 8-9 Hz, low alpha frequencies. It is probable that her high anxiety also correlates with this low amplitude 8-9 Hz alpha.
The foregoing discussion has already included many comments concerning treatment. A summary for single channel NFB training is provided by the feedback screen already shown in Figure 8. For most patients, decreasing very high amplitude theta (4-8 Hz) and/or alpha (8-10 and/or 10-12 Hz) and high frequency beta wherever it occurs between 20 & 36 Hz, while enhancing SMR (12-15 Hz) and low frequency beta (15-19 Hz) and doing HRV is a very effective treatment of choice (Figure 8). Note that we do not inhibit 40 Hz; indeed, 39 to 41 Hz may be enhanced for improved focus and learning (Sheer 1970; Rougeul-Buser, 1983; Steriade, 2005). For very complex cases, such as may be seen in post-concussion syndrome, 19 channel assessment and LORETA are used and the LORETA z-score NFB program will match the patient’s symptoms, the brain areas known to be associated with those functions , and the areas found in the assessment EEG to be more than 2 standard deviations outside the data base norms. Figure 15 shows areas seen in a mid-sagittal section where functions are matched for anxiety and for attention. Often at the ADD Centre a patient with post-concussion syndrome will alternate single channel NFB sessions and LORETA z-score NFB sessions. Z-score training allows the practitioner to train towards the data base 0 point – the average for the data base population. HRV and metacognitive strategies are part of each session, the former to provide a stress management tool and the latter to practice on-task skills that can transfer to everyday life.
Put Figure 15 about here:
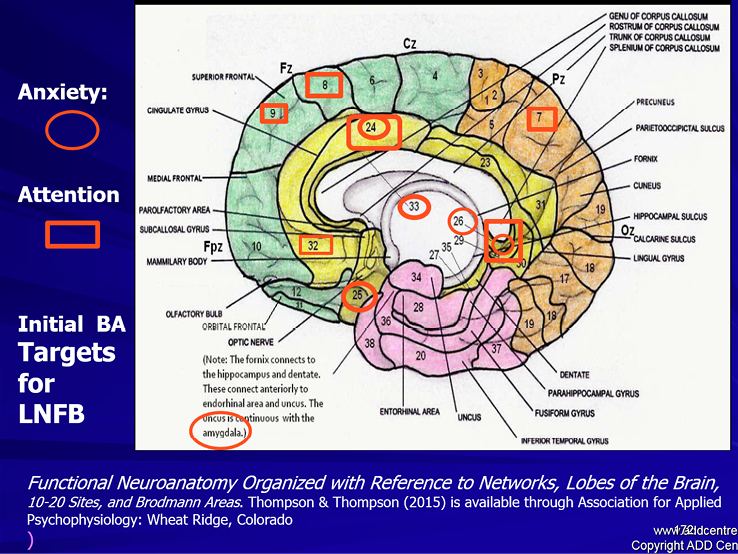
Figure 15. Some of the important BA areas that the LORETA NFB training program can target. The symptoms are «matched» to the functions of these BAs. We can target these sites with LORETA NFB to improve regulation of attention and anxiety
(From Thompson & Thompson, Functional Neuroanatomy, 2015b)
Efficacy & Brief Research Review
The positive clinical changes we observe in virtually all our patients at the ADD Centres are supported by numerous research reports in the literature. (Lubar 1976, 1995, Thompson & Thompson 1998, Gevensleben et al., 2009, Ghaziri et al., 2013, Arns et al., 2009, ). Early studies using NFB for ADHD measured pre and post changes, including changes in scores on standardized IQ tests. Perhaps the most startling finding was that IQ, which was always thought to be a stable unchangeable variable, increased by 10 points in children after 40 sessions of single channel NFB training to decrease theta-beta ratios (Lubar 1995, Linden et al., 1996). In our 1998 paper reporting on results with 111 patients, both children and adults, an average 12 point gain on the Wechsler Intelligence Scales was reported (Thompson & Thompson 1998).
Arns’ meta-analysis used 15 studies that met their strict criteria, including being controlled and randomized. It had 1194 subjects across 5 studies in Germany, 5 in the USA, 2 in Switzerland, 1 in Canada, 1 in China, and 1 in Russia. This meta-analysis gave NFB for ADHD the highest level (level 5) efficacy, concluding that NFB treatment was both efficacious and specific (Arns et al., 2009). It was considered superior to the accepted medical management using medications because there were no negative side effects and the results lasted.
In addition, structural changes in the brain have also been reported. A study done in Montreal, using MRI, demonstrated changes in gray matter volume and, using diffusion tensor imaging (anisotropy) increases in white matter volume too (Ghaziri et al., 2013). This was shown in controlled research with healthy university students at the U. de Montreal, rewarding increased beta activation with NFB enhancement of 15-18 Hz activity between F4 & P4. Those locations would improve neuronal communication between frontal and parietal regions at locations along the arcuate fasciculus in the right hemisphere to improve sustaining attention. Beauregard and Levesque (2006), also in Montreal, demonstrated that fMRI measures in children with ADHD after NFB training showed increased activation in important brain areas for attention: the right anterior cingulate, left substantia nigra, and the caudate nucleus. Juri Kropatov in St. Petersburg, Russia has published on changes found in ERPs (Kropotov, 2009). He noted that 20 sessions of beta-training caused a dramatic change in cognitive ERPs elicited in a go no-go task. The reduced amplitude of the P300 response that was initially found in those with ADHD increased to normal levels. He stated that this reflected a modification of the brain system responsible for executive functions (Grin’-Yatsenko 2001; Kropotov, 2009).
Gani and his colleagues in Germany (2008) published on the long term stability of improvements with NFB in a two year follow up of a multicentre, randomized, controlled research study. This 2-year follow-up compared feedback of slow cortical potentials and of theta-beta amplitudes in children with attention-deficit/hyperactivity disorder (ADHD). Both methods were equally effective in ameliorating the symptoms of ADHD and, in the group that received regular NFB, half the subjects at follow-up no longer qualified for a diagnosis of ADHD (Gani et al., 2008).
Conclusion
EEG and biofeedback measures provide helpful ways to monitor a client’s thinking and emotional responses. Both monitoring of finger temperature and skin conductance, to provide a window into a person’s emotional responses during a therapy session, and training using neurofeedback and biofeedback, especially heart rate variability training, in order to achieve improved self-regulation of attention and emotions, can be helpful additions in a mental health practitioner’s office practice. These techniques, which are solidly based on learning theory, and validated by research, are particularly helpful for the effective and side-effect free treatment of problems with attention and anxiety.
References
Arns, M., De Ridder, D., Strehl, U., Breteler, M., & Coenen, A. (2009). Efficacy of neurofeedback treatment in ADHD: The effects on inattention, impulsivity and hyperactivity: A meta-analysis. Clinical EEG and Neuroscience, 40, 180-189.
Bagherzadeh, Y., Baldauf, D., Pantazis, D., & Desimone, R. (2019). Alpha Synchrony and the Neurofeedback Control of Spatial Attention. Neuron. j. neuron, 11.001; DOI: 10.1016
Beauregard, M., & Levesque, J. (2006). Functional Magnetic Resonance Imaging Investigation of the Effects of Neurofeedback Training on the Neural Bases of Selective Attention and Response Inhibition in Children with Attention-Deficit/Hyperactivity Disorder. Applied Psychophysiology and Biofeedback, 31, 3-20.
Blair, K., Shaywitz, J. Smith, B., Rhodes, R. et al. (2008). Response to Emotional Expressions in Generalized Social Phobia and Generalized Anxiety Disorder: Evidence for Separate Disorders. American Journal of Psychiatry, 165, 1193-1202.
Buckner, R. L., Andrews-Hanna, J. R., Schacter, D. L. (2008). The Brain Default Network: Anatomy, Function, and Relevance to Disease. Annals of the New York Academy of Sciences. 1124, 1-38. doi10 1196/annals.1440.011.
Catani, M. & de Schotten, M. T. (2012). Atlas of Human Brain Connections. New York: Oxford University Press.
Curtin,., Fleckenstein ., Keeshin. ., Yurgelun,. ., ., ., & . . (2018). Increased risk of diseases of the basal ganglia and cerebellum in patients with a history of attention-deficit/hyperactivity disorder. , 43, 2548-2555
Gani, C., Birbaumer, N., & Strehl, U. (2008). Long term effects after feedback of slow cortical potentials and of theta-beta amplitudes in children with attention-deficit/hyperactivity disorder (ADHD). International Journal of Bioelectromagnetism, 10, 209-232.
Gevensleben, H., Holl, B., Albrecht, B., Vogel, C., Schlamp, D., Kratz, O., Studer, P., Rothenberger, A, Moll, G. H. & Heinrich, H. (2009). Is neurofeedback an efficacious treatment for ADHD? A randomised controlled clinical trial. Journal of Child Psychology and Psychiatry, 50, 780-789.
Gevirtz, R. (2013). The Nerve of that Disease: The Vagus Nerve and Cardiac Rehabilitation. Biofeedback, 4, 32-38.
Gevirtz, R. N., Lehrer, P., & Schwartz, M. S (2017). Cardiorespiratory Measurement and Assessment in Applied Psychophysiology. In M.S. Schwartz & F. Andrasik (Eds), Biofeedback: A Practitioners Guide (pp. 85-97). New York. Guilford Press, 4th edition.
Ghaziri, J., Tucholka, A., Larue, V., Blanchette-Sylvestre, M., Reyburn, G., Gilbert, G., Lévesque, J. & Beauregard, M. (2013). Neurofeedback training induces changes in white and gray matter. Clinical EEG & Neuroscience, 44, 265-272.
Grin’-Yatsenko, V.A., Kropotov, J.D., Ponomarev, V.A., Chutko, L.S. & Yakovenko, E.A. (2001). Effect of biofeedback training of sensorimotor and beta-sub-1 EEG rhythms on attention parameters. Human Physiology, 27, 259-266
Kropotov, J. D. (2009). Quantitative EEG, Event-Related Potentials and Neurotherapy. San Diego, CA: Academic Press, Elsevier.
Lehrer, P. M. (2007). Biofeedback Training to Increase Heart Rate Variability. In P. Lehrer, , R. Woolfolk,. & W. Sime, (Eds.) Principles and Practice of Stress Management: Third Edition (227-148). New York: Guilford Press.
Li, C., Yan, P., Bergquist, K. L., & Sinha, R. (2007). Greater activation of the «default» brain regions predicts stop signal errors. NeuroImage, 38, 640-648.
Linden, M., Habib, T., & Radojevic, V. (1996). A controlled study of the effects of EEG biofeedback on cognition and behavior of children with attention deficit disorder and learning disabilities. Biofeedback and Self-Regulation, 21, 106-111.
Lubar, J. F., & Shouse, M. N. (1976). EEG and behavioral changes in a hyperkinetic child concurrent with training of the sensorimotor rhythm (SMR): A Preliminary report. Biofeedback and Self-Regulation, 3, 293-306.
Lubar, J. F., Swartwood, M. O., Swartwood, J. N. & O’Donnell, P. H. (1995). Evaluation of the effectiveness of EEG neurofeedback training for ADHD in a clinical setting as measured by changes in TOVA scores, behavioral ratings, and WISC-R performance. Biofeedback and Self-Regulation, 21, 83-99.
Majerus, S. L., D’Argembeau, A. et al. (2012). Attention Supports Verbal Short-Term Memory via Competition between Dorsal and Ventral Attention Networks. Cerebral Cortex, 22, 1086-1097.
Mayberg, H. S., Lozano, A. M., Voon, V., McNeely, H. E., Seminowicz, D., Hamani, C., Schwalb, J. M., & Kennedy, S. H. (2005). Deep brain stimulation for treatment-resistant depression. Neuron, 45, 651-660.
di Michele, F., Prichep, L., John, E. R., Chabot, R. J. The neurophysiology of attention-deficit/hyperactivity disorder. International Journal of Psychophysiology. 58, 81-93. PMID 15979751 DOI: 10.1016/j.ijpsycho.2005.03.011
Monastra, V. J., Lubar, J. F., Linden, M., VanDeusen, P., Green, G., Wing, W., Phillips, A. & Fenger T. N. (1999). Assessing attention deficit hyperactivity disorder via quantitative electroencephalography: An initial validation study, Neuropsychology, 13, 424-433.
Monastra, V.J., Lynn, S., Linden, M., Lubar, J.F., Gruzelier, J. & La Vaque, T.J. (2005). Electroencephalographic biofeedback in the treatment of attention-deficit-hyperactivity disorder. Applied Psychophysiology and Biofeedback, 30, 95-114.
Northoff, G., Heinzel, A., de Greck, M., Bermpohl, F., Dobrowolny, H., & Panksepp, J. (2006). Self-referential processing in our brain - A meta-analysis of imaging studies on the self. NeuroImage 31, 440-457. DOI: 10.1016/j
Ogrim, G., & Kropotov, J. D. (2019). Predicting Clinical Gains and Side Effects of Stimulant Medication in Paediatric Attention-Deficit Hyperactivity Disorder by Combining Measures from qEEG and ERPs in a cued GO/NOGO task Clinical EEG and Neuroscience, 50, 34-43.
Otten, I. & Rugg, M. (2001). When more means less: neural activity related to unsuccessful memory encoding. Current Biology, 11, 1528-1530.
Paquette, V., Beauregard, M., & Beaulieu-Prévoste, D. (2009). The effect of psychoneurotherapy on brain electromagnetic tomography in individuals with major depressive disorder. Psychiatry Research. Neuroimaging, 174, 231-239.
Posner, M.I., Sheese, B.E., Odludas¸ Y., & Tang, Y. (2006). Analyzing and shaping human attentional networks. Neural Networks, 19, 1422-1429. (www.sciencedirect.com) 2006 Special Issue.
Rice, K. M., Blanchard, E. B., & Purcell, M. (1993). Biofeedback treatments of generalized anxiety disorders: Preliminary results. Biofeedback and Self-Regulation, 18, 93-105.
Rougeul-Buser A., Bouyer J.J., Montaron M.F., & Buser P. (1983). Patterns of activities in the ventro-basal thalamus and somatic cortex S1 during behavioral immobility in the awake cat: focal waking rhythms. Experimental Brain Research, 7, 67-87.
Sarkar, P., Rathee, S.P. & Neera, N. (1999). Comparative efficacy of pharmacotherapy and biofeedback among cases of generalized anxiety disorder. Journal of Projective Psychology & Mental Health, 6, 69-77.
Sears, W., & Thompson, L. (1998). The A.D.D. Book: New understandings, new approaches to parenting your child. New York: Little, Brown & Co.
Seeley, W., Menon, V., Schatzberg, A., Keller, J., Glover, G., Kenna, H., Reiss, A. & Greicius, M. (2007). Dissociable Intrinsic Connectivity Networks for Salience Processing and Executive Control. The Journal of Neuroscience, 27, 2349-2356.
Sheer, D.E. (1977). Biofeedback training of 40 Hz EEG and behavior. In Burch, N. & Altshuler, H.I. (eds.) Behavior & brain electrical activity. New York: Plenum.
Steriade, M. & McCarley, R. W. (2005). Brain Control of Wakefulness and Sleep. Springer, New York.
Swanson, J.M., Arnold, E.L., Molina, B.S.G., Sibley, M.H., Hechtman, L.T., Hinshaw, S.P., Abikoff, H.B., et al. (2017). Young adult outcomes in the follow-up of the multimodal treatment study of attention-deficit/hyperactivity disorder: symptom persistence, source discrepancy, and height suppression. The Journal of Child Psychology and Psychiatry, 58.
Thatcher, R. & Lubar, J. (2014). Z-Score Neurofeedback: Clinical Applications. New York: Academic Press.
Thayer, J. F., Åhs, F., Fredrikson, M., Sollers, J. J., III, & Wager, T. D. (2012). A meta-analysis of heart rate variability and neuroimaging studies: Implications for heart rate variability as a marker of stress and health. Neuroscience & Biobehavioral Reviews, 36, 747-756.
Thayer, J., Hansen, A., Saus-Rose, E. & Johnson, B.H. (2009). Heart rate variability, prefrontal neural function, and cognitive performance: The neurovisceral integration perspective on self-regulation, adaptation, and health. Annals of Behavioral Medicine Publication of the Society of Behavioral Medicine, 37, 141-153.
Thompson, L. & Thompson M. (1998). Neurofeedback combined with training in metacognitive strategies: Effectiveness in students with ADD. Applied Psychophysiology and Biofeedback, 23, 243-263.
Thompson, M. & Thompson, L. (2020 in press). Neurofeedback for Stress Management. In Lehrer, P., Woolfolk, R. & Sime, W. (Eds.) Principles and Practice of Stress Management, 4th Edition, New York: Guilford Publications.
Thompson, M. & Thompson, L. (2015a) The Neurofeedback Book: An Introduction to Basic Concepts in Applied Psychophysiology, Second Edition. Wheat Ridge, CO: Association for Applied Psychophysiology.
Thompson, M., & Thompson, L. (2015b) Functional Neuroanatomy: Organized with reference to networks, lobes of the brain, 10-20 sites, and Brodmann areas. Wheat Ridge, CO: Association for Applied Psychophysiology and Biofeedback
Vossel, S., Geng, J. J., & Fink G. R. (2014). Dorsal and Ventral Attention Systems: Distinct Neural Circuits but Collaborative Roles. The Neuroscientist, 20, 150-159.
Vles, J.H.S., Feron, F.J.M., Hendriksen, J.G.M., Jolles, J., Kroonenburgh, M.J.P.G., Weber, W.E.J. (2003). Methylphenidate Down-Regulates the Dopamine Receptor and Transporter System in Children withAttention Deficit Hyperactivity Disorder (ADHD). Journal of Neuropediatrics, 34, 77-80.
Weissman, D.H., Roberts, K.C., Visscher, K.M. & Woldorff M.G. (2006), The neural bases of momentary lapses in attention, Natural Neuroscencei, 9, 971-978.
Yanofski, Jason (2010:).The Dopamine Dilemma: Using Stimulants and Antipsychotics Concurrently. Psychiatry (Edgmont), 7, 18-23.
Yanofski, Jason (2011). The Dopamine Dilemma – Part II: Could Stimulants Cause Tolerance, Dependence, and Paradoxical Decompensation? Innovations in Clinical Neuroscience, 8, 47-53.
FOOTNOTE for page 1:
Thanks are given to Andrea Reid-Chung (Clinical Coordinator) and her team, senior staff Lena Santhirasegaran, Maya Berenkey, Erik Bullock, Zifeng Meng for keeping the ADD Centre running, providing case examples, and enabling this paper to be written.
Vol. 27, Issue 1, February 2021